Debugging Kubernetes CrashLoopBackOff
Step-by-step runbook for the most common pod failure mode. Learn probe configuration, OOMKill diagnosis, and container restart strategies.
Understanding CrashLoopBackOff
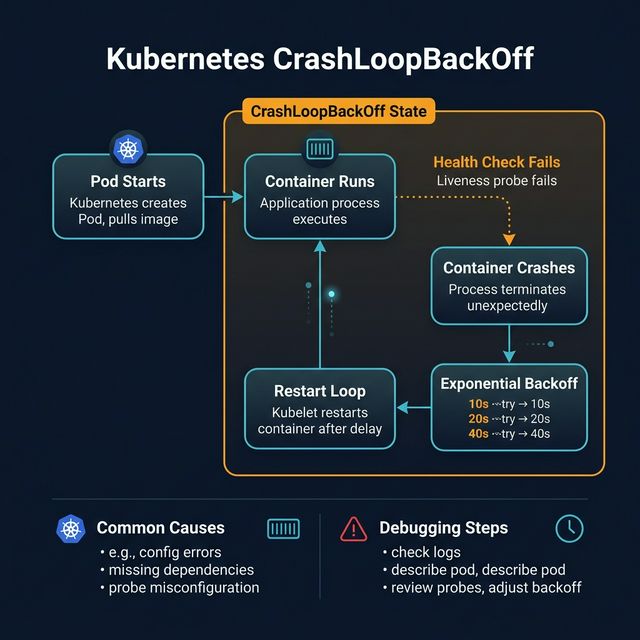
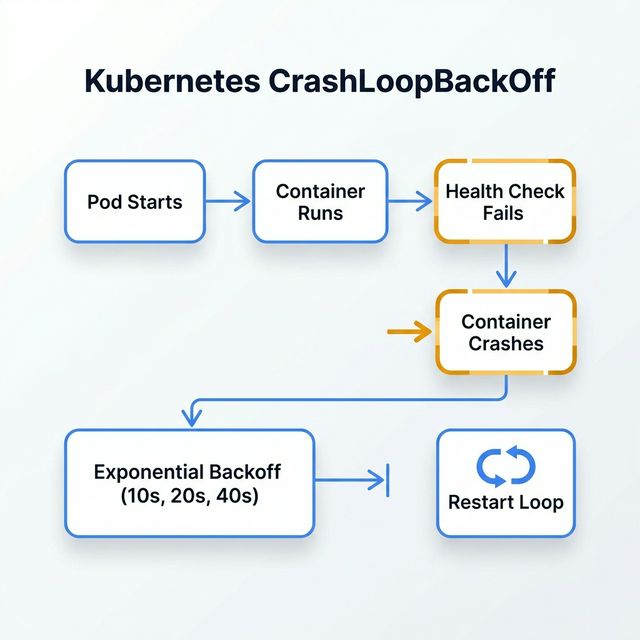
CrashLoopBackOff is the most common Kubernetes failure mode. It occurs when a container starts, crashes, and is restarted by kubelet in an exponentially increasing back-off cycle (10s, 20s, 40s, ... up to 5 minutes).
The three most frequent root causes are: application errors on startup, misconfigured liveness/readiness probes, and OOMKill from insufficient memory limits.
Step 1: Check Pod Events
Start with kubectl describe pod to see the Events section. Look for "Back-off restarting failed container" messages and note the exit code. Exit code 1 means application error, 137 means OOMKilled, and 143 means SIGTERM.
Next, check container logs with kubectl logs to see the output from the last crashed container. The --previous flag is critical — without it, you may see logs from a container that hasn't had time to produce output.

| Exit Code | Signal | Meaning | Action |
|---|---|---|---|
| 0 | — | Success | Check restart policy |
| 1 | — | App Error | Check logs --previous |
| 137 | SIGKILL | OOMKilled | Increase memory limit |
| 143 | SIGTERM | Graceful stop | Check preStop hooks |
| 139 | SIGSEGV | Segfault | Debug app binary |
Step 2: Probe Configuration
Misconfigured probes are a silent killer. If your liveness probe fires before the application is ready, Kubernetes will restart the container in an infinite loop.
Best practice: set initialDelaySeconds to at least your application's startup time, use periodSeconds: 10, and set failureThreshold: 3. For JVM or Node.js apps, consider startup probes which disable liveness checks until the app reports ready.
livenessProbe:
  httpGet:
    path: /healthz
    port: 8080
  initialDelaySeconds: 30  # Must exceed startup time
  periodSeconds: 10
  failureThreshold: 3
startupProbe:            # For slow-starting apps
  httpGet:
    path: /healthz
    port: 8080
  failureThreshold: 30
  periodSeconds: 5
Step 3: Memory and Resource Limits
OOMKill (exit code 137) means your container exceeded its memory limit. Check kubectl top pod to see current usage. Set requests to the P50 usage and limits to the P99 + 20% headroom.
For JVM workloads, remember that the JVM heap is only part of memory consumption. Add metaspace, thread stacks, and native memory: requests.memory = Xmx + 256Mi is a good starting formula.
Prevention Checklist
Build a runbook for your team: 1) Always set resource requests AND limits, 2) Use startup probes for slow-starting apps, 3) Set liveness initialDelaySeconds > startup time, 4) Monitor container restart counts in Prometheus, 5) Alert on CrashLoopBackOff events via PagerDuty.
pages.blog.ctaTitle
pages.blog.ctaDesc