The Modern Observability Stack
Prometheus, Grafana, Loki, and Tempo — building a unified observability platform. From metrics to traces to logs.
The Three Pillars
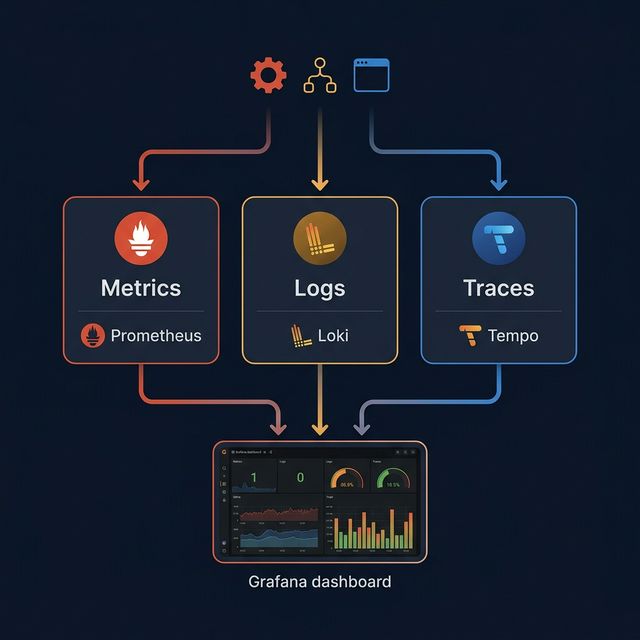
Modern observability is built on three pillars: metrics (Prometheus), logs (Loki), and traces (Tempo). Together with Grafana as the visualization layer, this stack provides complete visibility into your systems.
The key advantage of this open-source stack: you own your data, avoid vendor lock-in, and can scale each component independently based on your needs.
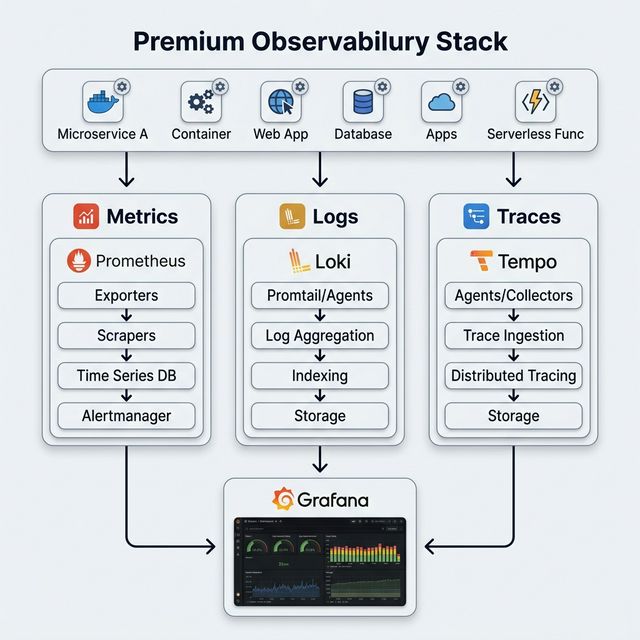
Prometheus Architecture
Deploy Prometheus with Thanos for long-term storage and high availability. Use recording rules to pre-compute expensive queries, and alerting rules with Alertmanager for notification routing.
Instrument your applications with client libraries. The four golden signals (latency, traffic, errors, saturation) should be your starting point. Add business metrics (orders/minute, signups/day) at the application level.
Unified Dashboard Strategy
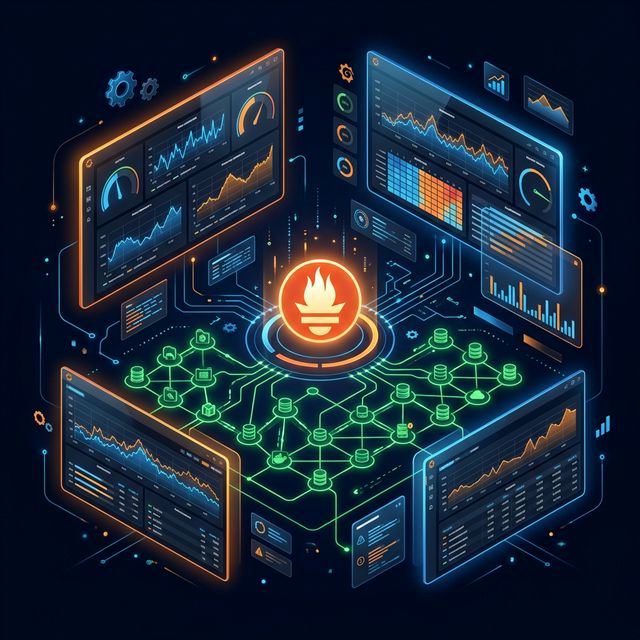
Create a dashboard hierarchy: L0 (executive KPIs), L1 (service health), L2 (component deep-dives), L3 (debugging). Link dashboards together so engineers can drill down from a high-level alert to the specific trace that caused it.
Use Grafana's Explore mode for ad-hoc investigation. Correlate metrics, logs, and traces by timestamp and trace ID. This is where unified observability pays dividends — a metric spike leads to correlated logs leads to a specific trace showing the slow SQL query.
| Level | Audience | Content | Refresh |
|---|---|---|---|
| L0 — Exec | C-Suite / Board | Revenue, SLA, uptime | 5 min |
| L1 — Service | On-Call Engineers | Health, errors, latency | 30 sec |
| L2 — Component | Team Leads | DB, Cache, Queue metrics | 15 sec |
| L3 — Debug | SRE / Developers | Traces, logs, profiles | Real-time |
pages.blog.ctaTitle
pages.blog.ctaDesc